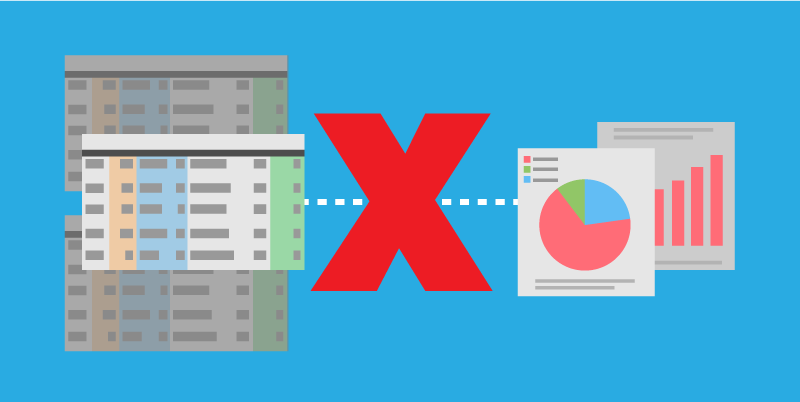
Why Spreadsheet Reporting is Bad for Business
Just about every business today uses spreadsheets in reporting, despite not being the right tool for the job. In fact, there are several reasons why spreadsheet reporting can be bad for your business and why you should consider the alternatives right now.

“What’s wrong with spreadsheet reporting?” I hear you ask. Quite a lot, actually.
Spreadsheets are designed primarily as an accounting tool, to digitally represent worksheets. They are not the versatile, multi-purpose solution that all-too-many business professionals mistake them to be.
In fact, businesses’ over-reliance on spreadsheets for processes like reporting is a well-documented problem, with expensive inaccuracies. There are numerous reasons why, but let’s focus on some of the key ones first.
The Problem With Spreadsheets
1. It’s easy to make mistakes.
Spreadsheets rely heavily on manual input, and human error is an obvious element of risk. Various studies over the years show that almost 90% of spreadsheets out there have errors, some creating financial discrepancies of billions – that’s right, billions.
Despite the costliness of potential errors, only a fraction of users are trained or experienced enough to leverage them properly. Those that are trained would know that they’re rarely even the right tool for the job. With such a high margin for error in spreadsheets as a reporting tool, how can you fully trust the answers you’re gathering?
2. They’re a productivity drain.
It’s simply time-consuming having to manually fill out hundreds of little cells, copying and pasting information from one sheet to the other and producing clumsy, ineffectual reports. Duplication of data is a frequent occurrence, requiring yet more time to fix if it’s even spotted at all. For so many companies this sort of process is conducted weekly, meaning a scheduled routine of time-wasting that few can afford.
3. Collaboration is difficult.
In fairness, this has been improved marginally through adoption of cloud-based platforms where you can better maintain a single copy of the spreadsheet – the all important “single version of the truth”. However, even with cloud-based spreadsheets, it’s tricky to govern how users input the data. Who is inputting? When are they inputting? If mistakes are made then there is no ‘paper-trail’ for auditing, and locally-stored and shared spreadsheets are even worse; multiple copies with conflicting input from numerous sources.
4. They’re simply no good for analytics.
Analytics are a vital part of reporting, and spreadsheets offer virtually nothing for this. Critical data gets hidden or lost completely in a mass of rows and columns, with no way to easily translate anything into tangible insights.
Data visualisation is almost impossible with the limited range of chart-building functions that spreadsheet programmes have to offer and without that there’s no way to summarise key data. Examining data from different spreadsheets becomes another manual process and there’s no way to link data from sheet to sheet – a link that is often as important as the data itself.
What’s The Right Tool For Reporting?
So what’s the alternative? The short answer: dedicated, purpose-made software, allowing your spreadsheet software to go back to doing what it does best for your business.
To report on your data it needs to be stored somewhere. The proper way to do this is with a database or data warehouse, not a spreadsheet and indeed not stored away in anything on your local machine. Databases allow for automated integration of data into storage, with the ability to access it on an ad-hoc basis.
Once stored and accessible you can view, manage and visualise your data in dedicated platforms. They range in scale from products such as Cognos Analytics, Microsoft Power BI and SQL Server to Dynistics dashboards and our very own intelligence and reporting platform ATLAS Publishing Intelligence.
Need to exchange data between systems? Instead of exporting and importing CSV files from system to system, why not expose your data to an API? This not only paves the way for frictionless connectivity between your systems, it is the foundation for improved integration with other applications, partners and customers.
All of these tools are configurable and easy to use. You and your teams can customise dashboards, data visualisations and reports to give you the data you actually need, in a fraction of the time, error-free. The benefits to your productivity and business intelligence are well worth the investment to get started and you’ll never regret kicking the spreadsheet addiction to the kerb.
Does your business reporting process need a spreadsheet intervention? It might be time to get help.
Featured Project
Streamlined Reporting for Residential Security CompanyChallenge: Manual Reporting Slow & Unreliable A company specialising in the installation of residential security and alarm systems was in need of an updated reporting solution. Their existing system involved a heavy-duty spreadsheet, with multiple tabs containing all their critical data about customers, sales records, products and sales actions. This data was manually extracted from the spreadsheets for reporting by applying filters across the numerous tabs. This process was time-consuming and didn’t offer the accuracy and reliability that the client needed for business reporting and to assess further sales opportunities. Solution: Automated Salesforce Reporting System Built Influential teams worked closely with the client to define the functions the existing spreadsheet and proposed a customised Salesforce implementation to automate their processes. The bespoke Salesforce instance was built and all data from the spreadsheet was imported. The company now has easy, unified access to their data and host of custom reports that are scheduled to run automatically when needed. Reports can now be generated in a fraction of the time with increased data accuracy, boosting company productivity and offering improved business insights. |